Ohio History Journal
- 1
- 2
- 3
- 4
- 5
- 6
- 7
- 8
- 9
- 10
- 11
- 12
- 13
- 14
- 15
- 16
- 17
- 18
- 19
JACK S. BLOCKER JR.
Market Integration, Urban Growth
and Economic Change in an Ohio
County, 1850-1880
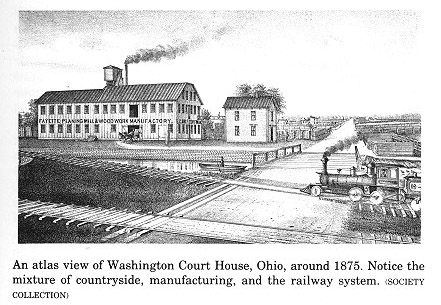
In March 1870, the editor of a local
newspaper in Washington
Court House, county seat of Fayette
County, Ohio, announced the
inauguration of a new service by the
Cincinnati and Muskingum
Valley Railroad:
The Train which leaves this place at
6.16 in the morning, arrives in the city
at 10.5, and leaves Cincinnati at 3:50
p.m., thus affording our citizens some
FIVE HOURS for business or pleasure. It
is a real accomodation, and we
hope it will be appreciated by the
public along the line and continued. By
this arrangement, Washington is rendered
almost one of the wards of Cin-
cinnati, and when the weather becomes a
little more pleasant, we expect
this morning Train will be extensively
patronized, and we are afraid to the
injury of our local business.1
The mingled eagerness and anxiety
expressed by this editor have
provided durable themes for commentators
on small-town life in the
nineteenth century. Beyond such
impressions, however, we know
little about the possibly complex
effects when small towns become
integrated into urban systems.2 Studies
of regional and national
systems have been unable to follow the
internal development of all
Jack S. Blocker Jr. is Associate
Professor of History at Huron College, London,
Ontario, Canada. Research and analysis
were supported by a research grant from the
Social Sciences and Humanities Research
Council of Canada. The author wishes to
thank George N. Emery and Dianne C.
Newell for their comments on an earlier
version of this paper.
1. Ohio State Register, March 31, 1870.
2. It is of course virtually inconceivable
that any community in nineteenth-
century America would not be part of an
urban system (although historians of com-
munities sometimes forget this fact).
The term "integration" is used in this essay to
denote movement along an ideal spectrum whose poles are
isolation and incorpora-
tion.
Market Integration
299
but the largest cities.3 At
the same time community microstudies
too rarely have been designed to relate
the internal changes they
describe to shifts in their communities'
external relationships.4 This
paper seeks to employ both external and
internal perspectives to
understand economic change within a
small urban community dur-
ing the process of integration.
Edward K. Muller has described the
shifts in urban relationships
in the middle Ohio Valley during the
period 1800-1860 as a three-
stage process of increasing integration.
In the pioneer period (1800-
1830) urban growth depended upon control
over a growing local
hinterland. Both hinterland growth and
achievement of control de-
pended in turn upon location with
respect to the region's principal
transportation routes, primarily the
Ohio River and its main tribu-
taries. In the second stage (1830-1850)
development of the regional
transportation network through
construction of canals and early
railroad lines stimulated rural
settlement and encouraged special-
ized staple production. Staple
production in turn led to the growth of
processing industries in towns located
on a canal or railroad line.
Cities such as Cincinnati, Dayton and
Columbus, which enjoyed
both access to a large, growing
hinterland and good connections to
national markets, experienced
significant growth based upon a di-
versifying manufacturing sector. This
shift in the basis for urban
growth toward nonprocessing industries
became more evident dur-
3. David Ward, Cities and Immigrants:
A Geography of Change in Nineteenth
Century America (New York, 1971); Edward K. Muller, "Selective
Urban Growth in
the Middle Ohio Valley, 1800-1860,"
Geographical Review, 66 (1976), 178-99; John B.
Sharpless, City Growth in the United
States, England and Wales, 1820-1861: The
Effects of Location, Size and Economic Structure on
Inter-Urban Variations in Dem-
ographic Growth (New York, 1977).
4. Gordon W. Kirk, Jr., The Promise
of American Life: Social Mobility in a
Nineteenth-Century Immigrant Community, Holland,
Michigan, 1847-1894 (Phil-
adelphia, 1978), shows transportation
improvements producing industrialization and
urban growth. Stuart Blumin, The
Urban Threshold: Growth and Change in a
Nineteenth-Century American Community
(Chicago and London, 1976), and Clyde
and Sally Griffen, Natives and
Newcomers: The Ordering of Opportunity in Mid-
Nineteenth-Century Poughkeepsie (Cambridge, Mass., and London, 1978), describe
Hudson River towns dependent upon
national markets since well before the begin-
ning of their study periods. Robert
Doherty, Society and Power: Five New England
Towns, 1800-1860 (Amherst, Mass., 1977), demonstrates ordering of
opportunity
according to an urban hierarchy, but
studies in detail change over only a single
decade, 1850-1860. Anthony F. C.
Wallace, Rockdale: The Growth of an American
Village in the Early Industrial
Revolution (New York, 1978), Don
Harrison Doyle,
The Social Order of a Frontier
Community: Jacksonville, Illinois, 1825-70 (Urbana,
Ill., 1978), and Robert J. Mitchell,
"Tradition and Change in Rural New England: A
Case Study of Brooksville, Maine,
1850-1870," Maine Historical Society Quarterly. 18
(Fall, 1978), 87-105, do not address the
question of integration.
300 OHIO HISTORY
ing the third stage, the 1850s, when
construction of the rail network
was pushed forward rapidly.
Transportation improvements pro-
duced an "upward shift of...
manufacturing functions in the urban
hierarchy" by reducing transport
costs for both agricultural pro-
ducts and manufactured goods. By 1860
the middle Ohio Valley had
become well integrated with national
markets; interregional and
intraregional integration had produced
relatively rapid growth for
those centers possessing the best
connections within the transporta-
tion network, and in such centers growth
was increasingly based
upon secondary manfactures.5
Washington Court House and its
hinterland during the years
1850-1880 furnish a laboratory within
which this process of integra-
tion may be examined in detail.6 Founded
in 1811, by 1850
Washington Court House was a small
district trade center, isolated
by its location off Ohio's canal and
early railroad lines. The building
of a railroad line between Washington
Court House and Cincinnati
in the early 1850s marked a new stage in
the town's integration into
regional and national markets, and the
ensuing quarter-century,
accessible through manuscript and
published federal census data,
provides a long enough period to assess
the principal effects of the
connection. Fayette County will be used
as an approximation of the
hinterland for Washington Court House.7
The questions to be asked concern the
effects of the railroad as an
instrument of integration into a larger
market system. The timing
of those effects is also of interest. As
an isolated local trade center
achieving interregional connections
relatively late, did Washington
Court House experience rapid or slow
growth, or decline? What
demographic and economic changes took
place in its agricultural
hinterland? What structural changes in
the community's economic
5. Muller, "Selective Urban
Growth." See also Margaret Walsh, "The Dynamics of
Industrial Growth in the Old Northwest
1830-70: An Interdisciplinary Approach," in
Business and Economic History: Papers Presented at the
Twenty-first Annual Meeting
of the Business History Conference, ed. Paul Uselding (Urbana, Ill., 1975), 12-29.
Secondary, or nonprocessing,
manufactures finish the product of another factory;
examples are hardwares, railroad cars,
clothing, farm implements, and machinery.
Primary, or processing, industries
operate on the products of agriculture, mining or
forestry. Examples include milling,
distilling and meatpacking.
6. Washington Court House is one of the
towns whose growth was examined by
Muller in "Selective Urban
Growth."
7. Fayette County contained no competing
centers: in 1880, when Washington
Court House had a population of 3,798,
the next largest community, Bloomingburg,
contained only 526 persons. Washington
Court House's hinterland was probably no
larger than Fayette County, as the county
was surrounded by six places of the same
or larger size than Washington Court
House, all within a 30-mile radius of the latter.
|
Market Integration 301 |
|
|

|
base were produced by integration, and how were they related to demographic shifts? Fayette had never ranked among Ohio's more populous counties. Settled during the first years of the century, until the coming of the railroad it had exceeded the statewide rate of population growth only once, during its pioneer decade (Figure 1). In 1850 Fayette stood 66th in population among the state's 87 counties. Farming was the principal activity of most of its citizens. Some livestock and livestock products were sold outside the county, but further develop- ment of commercial agriculture was restricted because of the diffi- culty of access to regional markets. In 1850, two turnpikes provided the best routes to market, one to Circleville on the Ohio Canal, 30 miles east of Washington Court House, the other to Xenia on the |
302 OHIO HISTORY
Little Miami Railroad, 30 miles
northwest. This meant a journey of
at least three days from the center of
the county simply to bring a
farmer's hogs or sheep to a railroad or
canal line, although corn and
wool could be moved somewhat more
rapidly. Thus, although the
county in 1850 ranked fifteenth in
bushels of Indian corn raised and
twenty-second in number of swine, it
stood thirty-first in value of
livestock and forty-first in cash value
of farms.8 Manufactures were
locally oriented and small in scale:
Fayette ranked seventy-fifth in
value of manufactured products and
seventy-seventh in capital in-
vested in manufacturing.9
The Cincinnati and Muskingum Valley
Railroad arrived at
Washington Court House in 1853,
providing Fayette County a
direct line to the Ohio River
metropolis. The county fathers capital-
ized on the opportunity for marketing
Fayette's farm products by
constructing a network of turnpikes so
extensive that by 1870 the
county ranked fifth in the state in
length of roads.10 Although the
distance as the crow flies from
Washington Court House to Col-
umbus is about half that to Cincinnati,
the railroad placed Fayette
County firmly within the orbit of the
larger city. By 1870 Cincinnati
and Muskingum Valley trains made a
scheduled daily stop each
way for passengers and another for
freight, as well as unscheduled
freight stops. The trip to Cincinnati
took about four-and-one-half
hours. In contrast, Washingtonians
travelling to Columbus relied
upon a thrice-weekly stagecoach which
took seven hours to travel
the shorter distance, returning on the
following day.11
The railroad achieved its most dramatic
effect in stimulating
Fayette County's agricultural sector.
Direct connection with the
pork-packing center of the Midwest and,
through Cincinnati, with
the national pork market encouraged
Fayette's farmers to extend
and intensify their cultivation of corn
and production of hogs.12
Cattle and sheep raising declined as
farmers shifted resources into
corn and hogs. By 1860 the county had
risen to eighth place among
8. Muller, "Selective Urban
Growth," 186; Map of Ohio, Williams' Ohio State Reg-
ister and Business Mirror for 1857 (Cincinnati, 1857); J. D. B. DeBow, Seventh Cen-
sus, . .. 1850 (Washington, D. C., 1853),862-64.
9. J. D. B. DeBow, A Statistical View
of the United States (Washington, D. C.,
1854), 295.
10. Annual Report of the Secretary of
State of Ohio, 1870, 267-73.
11. Ohio State Register, March
24, 31, May 26, 1870.
12. Margaret Walsh has pointed out the
dependence of the pork industry in the
mid-nineteenth century upon the national
market. See "Pork Packing as a Leading
Edge of Midwestern Industry,
1835-1875," Agricultural History, 51 (October 1977),
715.
Market Integration
303
Ohio's now 88 counties in bushels of
corn produced, and by 1870 to
third. In 1860 only ten counties raised
more swine than Fayette, in
1870 only two, and only a single county
reported a higher value for
animals slaughtered or sold for
slaughter. By 1870 Fayette County
had risen to seventh place in value of
livestock, twenty-second in
cash value of farms, and third in value
of all farm products.l3 In
1880 Fayette County still ranked among
the top corn and hog pro-
ducing counties of Ohio, although the
value of its products had
declined both absolutely and relatively
as a result of the lengthy
depression of the 1870s, which seems to
have affected pork prices
more severely than those of other farm
products.14
Clearly the increased integration into a
regional marketing net-
work produced by the railroad stimulated
staple production in
Fayette County. It also encouraged
population growth, as both the
county as a whole (Figure 1) and its
rural areas saw population
increase faster than the statewide
average. Rural population
growth in Fayette County did not however
imply extensive settle-
ment of new farms upon unoccupied land,
for in 1850 84 percent of
the total farmland of 1880 was already
included in existing farms.15
More land was put into production, but
most of it was simply por-
tions of existing farms that had been
left uncleared or uncultivated
because of restricted market
opportunities.16 Rural population
13. Joseph C. G. Kennedy, Agriculture
of the United States, 1860 (Washington,
D.C., 1864), 112-19; Ninth Census, vol.
3, Statistics of Wealth and Industry (Washing-
ton, D. C., 1872), 222-29. Value of farm products was
not reported in 1850 or 1860; in
those years the census also reported only the value of
animals slaughtered in each
county rather than the more inclusive category of 1870.
14. Report on the Productions of Agriculture As
Returned at the Tenth Census
(June 1, 1880) (Washington,
D. C., 1883), 129-30, 166-67, 201-02; G. F. Warren and F.
A. Pearson, Wholesale Prices for 213
Years, 1720-1932 (Ithaca, N. Y., 1932), 69-71,
84-86; Anne Bezanson et al., Wholesale
Prices in Philadelphia, 1852-1896 (Phil-
adelphia, 1954), 20-22, 84, 87, 253-55;
Joseph D. Weeks, "Report on the Average
Retail Prices of Necessaries of Life in
the United States," Report on Statistics of
Wages in Manufacturing Industries,
Tenth Census, vol. 20 (Washington, D.
C., 1886),
74-83; Cf. O. V. Wells, "The
Depression of 1873-79," Agricultural History, 11 (July,
1937), 242.
15. DeBow, Statistical View, 292;
Report on the Productions ofAgriculture, 129-30.
16. Improved acreage increased between
1850 and 1860 by 37.5 percent, faster
than the statewide average, from 59.2
percent of total farmland in Fayette County to
77.8 percent. At the same time the
number of farms and total farm acreage increased
by only 5.7 percent and 4.6 percent
respectively, both well below the statewide rate.
Computed from DeBow, Statistical
View, 169, 292, and Kennedy, Agriculture of the
U. S., 116, 211. In 1860 the total number of farms was not
reported for each county;
instead the Census reported only those
farms three acres or more in size. I have
assumed that, as in 1870, there were no
farms under three acres in Fayette County.
See Ninth Census, vol. 3, 360.
304 OHIO HISTORY
growth was therefore provided less by
new farm operators than by
new hands hired by Fayette farmers to
place increased acreage
under cultivation.
By increasing the demand for services,
agricultural expansion
and population growth in its rural
hinterland produced urban
growth in Washington Court House. The
town's population increase
from 569 in 1850 to 1,035 in 1860 was
greater, compared to other
urban places in the middle Ohio Valley
region, than its relative size
in 1850 would have led one to expect.17
Population growth was
based upon expansion in both commerce
and primary manufactures.
The 1850s saw Fayette's capital
invested in manufacturing and
value of manufactured products increase
faster than both the
statewide average and the rate of
Cincinnati's Hamilton County.
But while Cincinnati was diversifying
into secondary manufactur-
ing, Fayette's growth occurred
primarily in processing industries
such as flour-milling and distilling.18
By 1860, then, increased market
integration had produced urban
growth in Washington Court House by
stimulating specialized sta-
ple production and population growth in
its rural hinterland. The
performance of this interior trade
center shows that Muller's model
correctly predicts the direction of
change and identifies the relevant
variables. But it also reveals that
secondary manufactures were not
the only stimulant to urban growth in
this region during the 1850s.
Together with other interior trade
centers gaining railroad connec-
tions for the first time in the 1850s,
Washington Court House ex-
perienced the sort of growth based upon
commerce and primary
manufactures which urban centers on the
canal and early railroad
network had enjoyed during the previous
two decades.19 Washing-
ton Court House and other previously
isolated urban places
achieved market integration and
consequent growth characteristic
of second-stage development while other
centers, previously inte-
grated, experienced third-stage growth.
Still, Washington Court
17. Muller, "Selective Urban
Growth," 193.
18. Capital invested in manufacturing
increased by 279 percent in Fayette County
during the 1850s, compared to 156
percent for Hamilton County and 97 percent for
Ohio. Value of manufactured products
grew by 479 percent in Fayette County, 126
percent in Hamilton County, and 95
percent in the state. DeBow, Statistical View,
179, 295; Manufactures of the United
States in 1860 (Washington, D. C., 1865), 450,
456, 484.
19. Other exceptions, generally in newly
settled areas, included Muncie, Winches-
ter, and New Castle, Indiana, and
London, Ohio. Muller, "Selective Urban Growth,"
194-95.
|
Market Integration 305 |
|
|
|
House was only a way-station on the Cincinnati and Muskingum Valley Railroad, not a junction town in the new railroad network. Therefore one should expect to find its growth levelling off after 1860, as its hinterland stabilized and its manufacturing functions moved upward in the urban hierarchy.20 Such a process has been documented by Roberta Balstad Miller's study of a single urban community (Syracuse, New York) and its hinterland (Onondaga County) during the period 1790-1860. Miller has reported finding a decline in hinterland commercial and manu- facturing activity as a result of transportation-related urban growth. The railroads built through Onondaga County "indirectly contributed to the decline of hinterland industrial and commercial facilities by encouraging the development of superior facilities in the regional transportation center, Syracuse." The total population of the hinterland stagnated and, as it did, the proportion of its resi- dents living in country villages increased.21 Population growth and distribution in Fayette County during 1850-1880 conformed to the pattern found by Miller. For the county as a whole, neither the agricultural expansion of the 1860s nor the
20. Ibid. 21. Roberta Balstad Miller, City and Hinterland: A Case Study of Urban Growth and Regional Development (Westport, Conn., 1979), 87-88. |
306 OHIO HISTORY
agricultural slump of the following
decade produced population
growth higher than the statewide rate
(Figure 1). What population
growth occurred after 1860 took place
largely in Washington Court
House, which grew to 2,117 in 1870 and
3,798 in 1880.22 Conse-
quences of population growth included
the founding of new Baptist
("colored," 1855), African
Methodist Episcopal (1867), and Evangel-
ical Lutheran (1873) churches, and
construction of a new building
for the Roman Catholic parish organized
in 1852.23 The year 1873
saw the creation of a lecture
association to sponsor visiting
speakers.24 Meanwhile,
Washington Court House suffered from a
housing shortage which continued into
the mid-1870s, and local
lawyers, judges and juries had begun the
series of remonstrances
over the inadequacies of the courthouse
and jail that would lead in
the 1880s to construction of the present
building.25 The proportion of
the county population living in urban
places increased steadily from
seven percent in 1850 to 23 percent in
1880.26 These population
trends reflected Fayette County's
further integration into the
hinterland of Cincinnati. Population
growth in Washington Court
House was undoubtedly connected with its
position as local trans-
portation center. But what was the
precise link between transporta-
tion network centrality and population
growth?
The manufacturing sector's spurt of
growth in the 1850s, based
upon expansion in the processing
industries, was followed in the
1860s by much slower growth and a shift
in orientation.27 Distilling
disappeared from Fayette County, and the
number of gristmills de-
clined. Manufacturing establishments,
never large, grew slightly
22. Washington Court House accounted for
86.6 percent of county population
growth in the 1860s and 52.6 percent in
the 1870s, compared to 14.5 percent in the
1850s.
23. Presbyterian (1813), Methodist
Episcopal (1817) and Baptist (1840) congrega-
tions had been founded before the coming
of the railroad. Fayette County Herald, May
30, 1872; Ohio State Register, April
10, 1873; R. S. Dills, History of Fayette County
(Dayton, 1881), 489-511.
24. Ohio State Register, March
27, 1873.
25. Fayette County Herald, March
23, 1871, November 27, 1873; Ohio State Regis-
ter, February 4, 1875.
26. The figures for 1860 and 1870 were
nine percent and 17 percent respectively.
Urban places were defined broadly as
those places distinguished from their
townships in the aggregate census
population reports. Their size during the three
decades ranged from 87 to 3,798
population.
27. Fayette County's capital invested in
manufacturing increased by 33 percent in
the 1860s, while in Hamilton County it
increased 125 percent and statewide, 148
percent. Value of manufactured products
increased by 66 percent in Fayette, 68
percent in Hamilton, and 122 percent
statewide. Manufactures of the U. S. in 1860,
450. 456, 484; Ninth Census, vol.
3, 392, 557.
Market Integration 307
smaller: the number of hands per
establishment was 3.9 in 1860, 2.9
in 1870, and 3.3 in 1880.28 The largest
establishment in 1870 was
the Van Deman and Dews Woolen Mill,
which occupied a former
distillery in Washington Court House,
employing 15 hands. This
suggests that most Fayette County
manufactures were produced by
artisans in small shops catering to a
local clientele.29
In the 1870s all indices of
manufacturing in Fayette County
showed absolute declines. Capital
invested in manufacturing de-
creased by 29 percent, and the value of
manufactured products fell
off by 46 percent. This undoubtedly
reflected the impact of the de-
pression of the 1870s, but the
manufacturing sector in Fayette
County suffered far more than those of
Hamilton County and the
state of Ohio, both of which showed
positive though reduced growth.
By 1880 both the capital invested in
Fayette County's manufactur-
ing and the value of its manufactured
products had fallen below
their 1860 levels.30
Population growth in Washington Court
House after 1860 thus
took place in a context of stagnation,
if not decline, in the manufac-
turing sector. Processing functions located
in Washington Court
House during the 1850s moved upward in
the urban hierarchy as
transportation costs fell. Secondary
manufactures were never estab-
lished on more than a local basis due to
Washington Court House's
unfavored position within the railroad
network; in fact, even local
needs were supplied more and more by
larger centers.
The manner in which Fayette County's
last woolen mill closed
confirmed the triumph of the new order.
Since one railroad, the
Cincinnati and Muskingum Valley, had
supplied the market con-
nection which undermined local
manufacturing, it was fitting that
another railroad should be the instrument which finally killed this
central branch of Fayette County
industry. In 1877 the former Van
Deman and Dews mill found its retail
trade cut off by a new railroad
28. Manufactures of the U. S. in
1860, 450; Ninth Census, vol. 3, 557; Tenth Cen-
sus, vol. 2, Manufactures (Washington, D. C., 1883),
161. This contrasts with Miller's
finding that average number of workers
per firm increased in both Syracuse and its
hinterland. City and Hinterland, 99-100.
29. The distillery had employed twenty
persons in 1860. For a contemporary recog-
nition and lamentation of the lack of
manufacturing in Washington Court House, see
Fayette County Herald, November 5, 1874.
30. Manufacturing capital grew by 29
percent in Hamilton County and 18 percent
in the state, while value of
manufactured products increased by 37 percent in Hamil-
ton County and 29 percent in the state.
In 1880 Fayette County ranked 86th in
capital invested in manufacturing, and
84th in value of manufactured products.
Ninth Census, vol. 3, 392, 557; Tenth Census, vol. 2, 161-62.
308 OHIO HISTORY
line, the Dayton and Southeastern,
passing between it and the rest
of the community. Unable to expand into
wholesale trade, the own-
ers sold the machinery to a buyer in
Kansas. Thereafter, the wool of
Fayette County sheep would be carded,
spun and woven outside the
county.31
Manufacturing stagnation however did
not necessarily imply
general economic stagnation, as per
capita wealth grew at least
through 1870.32 It did mean a shift in
the relative sizes of various
functional groups within Washington
Court House, with corres-
ponding implications for social
structure. Two apparent shifts in the
functional-structure of the work force
were simply artifacts of a
change in census enumeration procedures
between 1850 and 1860
(Table 1).33 The enumeration
of women's occupations for the first
time in 1860 was responsible for both
an increase in the percentage
of service occupations and a percentage
decline in commercial posi-
tions. The railroad did bring some jobs
to Washington Court House
over the long term, and these were
reflected in the relative growth
of the transport sector.
The principal real shift was a decline
in the percentage of the
work force whose occupations could be
readily identified with manu-
facturing, from over half of the work
force in 1850 to less than
one-third in 1880. At the same time the
Unclassified group, consist-
ing primarily of those reported as
laborers without place or mode of
work, increased from two to 15 percent.
Possibly all of these laborers
actually worked in manufacturing; if
this were the case, the actual
relative decline in the crafts and
manufacturing category from 1850
to 1880 would have been substantially
smaller, from 53.0 to 45.5
percent. More likely, the growing
number of laborers were dis-
tributed over several functional
categories, including some or all of
the following: those who worked for
nearby farmers while living in
town (farm); those who hauled or
carried for merchants (commerce
31. Dills, History of Fayette County,
582.
32. Total wealth per capita grew from
$846 in 1860 to $1519 in 1870, an increase of
79 percent. Discounting for inflation
leaves a real per capita increase of 24 percent.
The value of real wealth per capita was $205 in 1850,
$535 in 1860, and $932 in 1870,
resulting in nominal percentage
increases of 161 percent during the 1850s and 74
percent during the 1860s. Discounting
for inflation leaves real per capita increases of
136 percent during the 1850s and 20
percent during the 1860s. Computed from the
manuscript federal censuses of 1850,
1860, and 1870, and from U. S. Bureau of the
Census, Historical Statistics of the
United States, Colonial Times to 1970 (Washing-
ton, D. C., 1975), 201. Ownership of
wealth was not reported in 1880.
33. Carroll D. Wright, The History
and Growth of the United States Census
(Washington, D. C., 1900), 152, 154.
Market Integration 309
Table 1:
Occupation of Work Force by Functional Category, Washington
Court House, 1850-1880 (in percentages)
Functional
Category
1850
1860 1870 1880
All
Commerce 26.1 17.8 21.0 20.4
Crafts and Manufacturing 51.0 39.5 32.2 30.4
Service 12.4 22.3 22.3 21.5
Government 0.7 3.1 2.3 1.1
Transportation 0.7 1.4 2.7 6.3
Farm 7.2 4.5 6.1 5.2
Unclassified 2.0 11.3 13.3 15.1
N 153 354 732 1086
Men
Commerce 26.1 21.6 24.6 23.6
Crafts and Manufacturing 51.0 42.6 35.9 32.0
Service 12.4 11.3 10.3 11.6
Government 0.7 3.8 2.8 1.4
Transportation 0.7 1.4 3.3 7.6
Farm 7.2 5.5 7.4 6.5
Unclassified 2.0 13.4 15.7 17.2
N 153 291 610 877
Women
Commerce 0.0 3.3 7.2
Crafts and Manufacturing 25.4 13.9 23.4
Service 73.0 82.0 62.7
Government Not 0.0 0.0 0.0
Transportation Recorded 0.0 0.0 0.5
Farm 0.0 0.0 0.0
Unclassified 1.6 0.8 6.2
N 63 122 209
Source: Manuscript
U. S. Census, Fayette County, 1850, 1860, 1870, 1880
or transportation); those who dug or carried for local
builders or for
the railroad (crafts and manufacturing,
transportation); those who
did odd jobs (service). In this case, decline in the
crafts and manufac-
310 OHIO HISTORY
turing occupations would have been the
principal functional
change.
A complementary perspective on economic
change in Washington
Court House may be obtained through
examination of the vertical
distribution of its work force (Table
2).34 Over the period 1850-1880
two groups, proprietary/low white-collar
and unskilled, increased in
relative size, while the remaining two,
professional/high white-
collar and skilled, experienced relative
decline. This overall pattern
held as well for the male work force;
for women a decline in the
skilled category was matched by an
increase among the proprietary/
low white-collar group, while the
remaining two groups in 1880
retained virtually the same shares as in
1860.
In Washington Court House as in other
communities, occupation
and opportunity to acquire property were
closely linked (Tables 3
and 4). Yet the town's increasing prosperity
in the period 1850-1870
meant that both the opportunity to
acquire property and the amount
held increased for nearly all
occupational groups.35 The single ex-
ception, skilled women workers, made up
only three percent of the
1870 work force.36
It is now possible to construct a
general picture of economic
change in Washington Court House and its
Fayette County hinter-
land in the aftermath of increased
market integration. The railroad
connection with Cincinnati brought
twenty years of prosperity to
Fayette County farmers by providing
improved access to a regional
processing center and a national market.
Agricultural prosperity
stimulated rural population growth
during the first decade of in-
tegration. After 1860 rural areas
experienced much slower popula-
tion growth as their urban center,
Washington Court House,
34. The discrepancy in size of the 1880
work force between Tables 1 and 2 is
composed of the following: 14 retired
persons who were considered to hold the status
of their former occupations although no
longer performing their functions; one person
classifiable by status but not by
function; two persons classifiable by function but not
by status.
35. The distribution of wealth changed
very little. For real estate holdings among
males 16 years of age and over, the Gini
index of inequality stood at .85 in 1850, .84 in
1860, and .84 in 1870. For total wealth
holdings among all persons aged 16 years and
over, the Gini index was .86 in 1860 and
.85 in 1870. Computed from the manuscript
federal censuses of 1850, 1860, and
1870.
36. Another, larger group, the male
proprietary/low white-collar workers (175 in
1870, 23.9 percent of the work force)
showed a nominal increase in mean total wealth
of 34.9 percent, but in fact experienced
a real decline of 10.2 percent when the
massive inflation of the 1860s is taken
into account. This was the only group whose
increase in mean wealthholding fell
behind the rate of inflation. It might seem that
this would imply a similar decline for
workers in commercial occupations, but the two
groups were not identical: the group,
male workers in commerce, registered a real
increase in mean total wealthholding,
1860-1870, of 27.7 percent.
Market Integration 311
Table 2:
Occupation of Work Force by Vertical Category, Washington
Court House, 1850-1880 (in percentages)
Vertical
Category
1850
1860 1870 1880
All
Professional and High
White Collar 24.2
11.6 5.6 5.6
Proprietary and Low
White Collar 19.6 24.3 25.4 28.8
Skilled 53.6 41.2 36.3 31.0
Unskilled 2.6 22.9 32.7 34.5
N 153 354 732 1099
Men
Professional and
High White Collar 24.2
14.1 6.7 6.7
Proprietary and Low White
Collar 19.6 27.5 28.7 32.1
Skilled 53.6 43.6 39.7 32.4
Unskilled 2.6 14.8 24.9 28.8
N 153 291 610 889
Women
Professional and High
White Collar 0.0 0.0 1.0
Proprietary and Low
White Collar Not 9.5 9.0 15.2
Skilled Recorded 30.2 19.7 25.2
Unskilled 60.3 71.3 58.6
N 63 122 210
Source: Manuscript
U. S. Census, Fayette County, 1850, 1860, 1870, 1880
absorbed most of the population increase taking place
in the county.
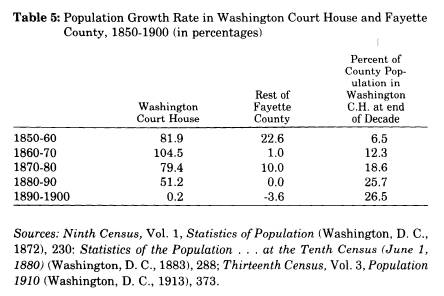
The population of Washington Court House continued to
grow fairly
rapidly until 1890, at least 30 years after
stabilization of population
growth in its hinterland (Table 5). In 1850 only one of
every 15
residents of Fayette County lived in Washington Court
House; by
1890 one of every four did so.37
37. Commercial activity and population growth in
Washington Court House were
probably stimulated during the 1880s by the arrival of
narrow-gauge railroad lines
312 OHIO HISTORY
Table 3:
Propertyholding Incidence in Work Force by Vertical Occupation-
al Category, Washington Court House, 1850-1870
Percent Property-
Vertical holders
Category 1850* 1860 1870
All
Professional and High
White Collar 73.0 95.1 97.6
Proprietary and Low
White Collar 40.0 66.3 76.9
Skilled 35.4 43.1 61.6
Unskilled 0.0 9.9 34.3
Total 44.4 47.2 58.6
Men
Professional and High
White Collar 73.0 95.1 97.6
Proprietary and Low
White Collar 40.0 68.8 78.3
Skilled 35.4 43.3 65.3
Unskilled 0.0 18.6 52.0
Total 44.4 54.0 67.9
Women
Professional and High No No
White Collar women
women
Proprietary and Low
White Collar Not 33.3 54.5
Skilled recorded 42.1 25.0
Unskilled 0.0 3.4
Total 15.9 12.3
* - Only real wealth holdings were reported in 1850
Source: Manuscript
U. S. Census, Fayette County, 1850, 1860, 1870
from Dayton in 1877 and from Springfield in the
following year, and of a standard-
gauge line, the Columbus and Cincinnati Midland, in
1884. Both narrow-gauge lines
were converted to standard gauge during the early
1880s. By 1891 the railroad lines
through Washington Court House had become part of two
national east-west sys-
Market Integration 313
Table 4: Mean
Wealthholding of Work Force by Vertical Occupational
Category, Washington Court House, 1850-1870 (in
dollars)
Vertical
Category 1850* 1860
1870
All
Professional and High
White Collar 1189 6187 21078
Proprietary and Low
White Collar 977 4942 6856
Skilled 462 941 1842
Unskilled 0 37 370
All 727 2314 3713
Men
Professional and High
White Collar 1189 6187 21078
Proprietary and Low
White Collar 977 5294 7144
Skilled 462 952 1992
Unskilled 0 69 578
All 727 2753 4400
Women
Professional and High No No
White Collar women
women
Proprietary and Low
White Collar Not 250 2264
Skilled recorded 863 337
Unskilled 0 6
All 284 275
* - Real estate only in 1850; real and personal estate
combined in 1860 and
1870
Source: Manuscript
U. S. Census, Fayette County, 1850, 1860, 1870
tems, the Pennsylvania and the Baltimore and Ohio, and
two regional north-south
systems, the Cincinnati, Hamilton and Dayton and the
Ohio Southern. See Traveler's
Official Railway Guide (New York, 1893), and Henry V. Poor, Manual of the
Rail-
roads (New
York. 1891).
314 OHIO HISTORY
Population growth and economic
prosperity in Washington Court
House were based upon the town's
commercial role as local entrepot,
where farm products were sold and
shipped and where manufac-
tured goods were purchased. The most
obvious manifestation of this
function was the monthly stock sale day
instituted in 1871, when
buyers, farmers and livestock all
converged on Washington Court
House, converting the town itself into a
huge market.38 (Public
drinking on stock sale day dramatized
the dangers of widespread
liquor consumption and thus helped to
provoke the Women's
Temperance Crusade of 1873-74, in which
Washington Court House
women were prominent by their success.)
In the 1850s Washington
Court House played a part, although
probably a relatively minor
one, in the processing of some of the
farm products shipped from its
hinterland. By the 1870s, however,
nearly all of the farm products
shipped out of Washington Court House
were processed elsewhere.
In all likelihood, so were most of the
manufactured goods shipped
into Washington Court House and sold
there. The Cincinnati con-
nection thus influenced Washington Court
House in two ways: by
solidifying its position as trading
center for its local hinterland, thus
opening the way for further commercial
growth; and by setting an
upper limit to the development of
manufacturing, thereby closing
off a second avenue for growth. The
damage to local business feared
by the newspaper editor in 1870 had
indeed been done, though not
in the manner he expected.
By defining the possibilities open to
Washington Court House, the
process of integration also defined the
channels of opportunity with-
in the community. Local commercial
dominance brought prosperity
at least during the years of
agricultural expansion before 1870; it
also meant that Washington Court House
became a beneficiary of
population flows from its hinterland as
well as from outside the
county. The structural limit on
manufacturing growth set by
Washington Court House's position
vis-a-vis Cincinnati meant that,
while property mobility was increasingly
available before 1870,
occupational mobility into the skilled
trades which made up most of
the manufacturing sector was tightly
circumscribed.
Decline of occupational mobility into
the skilled trades was of
course not limited to Washington Court
House during the years
1850-1880. Although it affected
different trades at different times,
the advance of factory production during
these years generally
38. Dills, History ofFayette County, 356-57.
|
Market Integration 315 |
|
|
|
undercut the position of artisan producers and local manufacturers.39 But it was market integration that exposed Washington Court House artisans and manufacturers to the com- petition of factory production, by bringing outside manufactured goods to Washington Court House and by providing its hinterland farmers with the cash incomes they needed to purchase them. Since white collar positions as a whole also did not keep pace with population increase, the result was a steady growth at the bottom of the occupational hierarchy. If this situation was likely to produce discontent among the growing numbers of unskilled workers, such discontent may have been muted or redirected in Washington Court House as elsewhere by a high rate of geographic mobility, racial and ethnic divisions, and, for the geographically stable, increasing opportunity to acquire property. 40 In addition, unskilled workers in
39. This process has been carefully documented by Griffen and Griffen, Natives and Newcomers, chs. 7-8. See also Alan Dawley, Class and Community: The Indus- trial Revolution in Lynn (Cambridge, Mass., 1976), ch. 3. 40. Between 1860 and 1870 the crude persistence rate for unskilled male workers was 20.9 percent, compared to 61.0 percent for professional and high white-collar, 31.3 percent for proprietary and low white-collar, and 37.0 percent for skilled work- ers. In 1860, one-fifth of the male work force were black, while another two-fifths were foreign-born. In 1870 the two groups' proportions of the male work force were nearly reversed. |
316 OHIO HISTORY
Washington Court House were dispersed
rather than concentrated
in a single industry.
For Fayette County, then, urbanization
and industrialization did
not proceed together. Indeed, urban
growth in Washington Court
House was accompanied by what one might
call de-
industrialization, a relative decline in
the manufacturing sector of
its local economy. Increasingly
Washington Court House became a
place where products were bought and
sold rather than made. A
shift in the structures which
encompassed Washington Court House
had entailed both growth and structural
change within the com-
munity.
JACK S. BLOCKER JR.
Market Integration, Urban Growth
and Economic Change in an Ohio
County, 1850-1880
In March 1870, the editor of a local
newspaper in Washington
Court House, county seat of Fayette
County, Ohio, announced the
inauguration of a new service by the
Cincinnati and Muskingum
Valley Railroad:
The Train which leaves this place at
6.16 in the morning, arrives in the city
at 10.5, and leaves Cincinnati at 3:50
p.m., thus affording our citizens some
FIVE HOURS for business or pleasure. It
is a real accomodation, and we
hope it will be appreciated by the
public along the line and continued. By
this arrangement, Washington is rendered
almost one of the wards of Cin-
cinnati, and when the weather becomes a
little more pleasant, we expect
this morning Train will be extensively
patronized, and we are afraid to the
injury of our local business.1
The mingled eagerness and anxiety
expressed by this editor have
provided durable themes for commentators
on small-town life in the
nineteenth century. Beyond such
impressions, however, we know
little about the possibly complex
effects when small towns become
integrated into urban systems.2 Studies
of regional and national
systems have been unable to follow the
internal development of all
Jack S. Blocker Jr. is Associate
Professor of History at Huron College, London,
Ontario, Canada. Research and analysis
were supported by a research grant from the
Social Sciences and Humanities Research
Council of Canada. The author wishes to
thank George N. Emery and Dianne C.
Newell for their comments on an earlier
version of this paper.
1. Ohio State Register, March 31, 1870.
2. It is of course virtually inconceivable
that any community in nineteenth-
century America would not be part of an
urban system (although historians of com-
munities sometimes forget this fact).
The term "integration" is used in this essay to
denote movement along an ideal spectrum whose poles are
isolation and incorpora-
tion.
(614) 297-2300